Kubernetes Tools
- Published on
- Authors

- Author
- Ram Simran G
- twitter @rgarimella0124
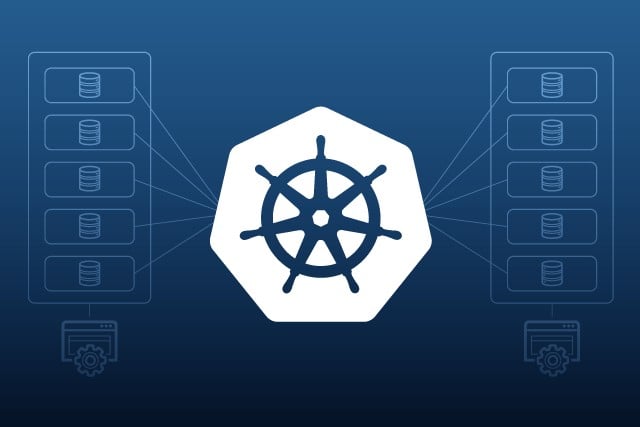
In the fast-paced world of container orchestration, Kubernetes (K8s) has become the de facto standard for managing scalable applications. However, its power comes with complexity—managing clusters, optimizing resources, ensuring security, and streamlining deployments can overwhelm even seasoned DevOps teams. That’s where these tools shine. Inspired by a popular tweet highlighting 20 game-changing Kubernetes tools, this blog post dives deeper: why we need each tool, how it boosts K8s performance (e.g., efficiency, scalability, and reliability), and key features that make your work easier.
These tools aren’t just add-ons; they’re force multipliers that reduce manual toil, cut costs, and accelerate innovation. Let’s break them down.
1. K9s - Terminal-Based UI for Lightning-Fast Cluster Ops
- Why we need it: Kubernetes CLI (kubectl) is powerful but verbose; K9s simplifies daily tasks like pod inspection and log tailing, preventing context-switching fatigue in high-stakes environments.
- Performance boost: Reduces cluster query latency by caching views and enabling real-time filtering, minimizing resource-intensive kubectl calls that could spike API server load.
- Ease-of-use features: Keyboard-driven navigation (Vim-like), multi-pane layouts for resources (pods, services), and customizable views—deploy changes in seconds without leaving the terminal.
2. OpenLens - Open-Source Kubernetes IDE for Team Visibility
- Why we need it: Teams often struggle with kubectl expertise gaps; OpenLens democratizes access, fostering collaboration without silos.
- Performance boost: Lightweight desktop app that aggregates cluster metrics without heavy backend queries, enabling proactive scaling to avoid over-provisioning.
- Ease-of-use features: Drag-and-drop YAML editing, visual topology graphs, and multi-cluster support—search and filter resources intuitively, like a IDE for code.
3. Karpenter - Next-Gen Cluster Autoscaler for Precise Provisioning
- Why we need it: Traditional autoscalers like Cluster Autoscaler waste resources on mismatched nodes; Karpenter ensures just-right sizing amid fluctuating workloads.
- Performance boost: Provisions nodes in under 30 seconds based on pod requirements, reducing idle capacity by 50-70% and improving overall cluster throughput.
- Ease-of-use features: Declarative YAML configs for node templates, integration with spot instances for cost savings, and automatic cleanup of unused nodes—no manual tuning.
4. OpenCost - Granular Cost Allocation Across Clouds
- Why we need it: Cloud bills explode without visibility; OpenCost attributes costs to namespaces/pods, empowering FinOps practices.
- Performance boost: Identifies inefficient workloads (e.g., over-requested CPU), optimizing resource requests to cut waste and stabilize cluster utilization.
- Ease-of-use features: Prometheus exporter for dashboards, multi-cloud support (AWS, GCP, Azure), and exportable reports—drill down to per-pod costs effortlessly.
5. ArgoCD - GitOps CD for Declarative Deployments
- Why we need it: Manual deploys lead to drift and errors; ArgoCD syncs Git state to clusters, enforcing version control at scale.
- Performance boost: Rollouts via progressive delivery reduce downtime, with health checks preventing bad deploys from impacting production traffic.
- Ease-of-use features: Web UI for app diffs, auto-sync policies, and RBAC integration—preview changes before applying, like Git pull requests for infra.
6. Kubecost - Enterprise Cost Monitoring with Savings Insights
- Why we need it: Beyond basics, it provides actionable recommendations; essential for teams chasing 30-60% savings in multi-tenant clusters.
- Performance boost: Anomaly detection flags resource hogs, enabling rightsizing that boosts pod density and lowers latency from contention.
- Ease-of-use features: AI-driven alerts, historical trend graphs, and integration with Slack/Teams—one-click optimization reports simplify budgeting.
7. Keda - Event-Driven Autoscaling Beyond CPU/Memory
- Why we need it: CPU-based scaling ignores real signals like queue lengths; KEDA ties to external metrics for reactive, workload-specific adjustments.
- Performance boost: Scales to zero during idle periods, reducing costs by 80% for bursty apps while maintaining sub-second response times.
- Ease-of-use features: 50+ scalers (Kafka, Redis), YAML-defined triggers, and HPA integration—configure once, forget the tuning.
8. Trivy - Fast Vulnerability Scanner for CI/CD
- Why we need it: Container images harbor risks; Trivy catches them early, preventing runtime exploits in production.
- Performance boost: Scans in seconds without false positives, ensuring secure images that don’t bloat with unpatched deps, improving startup times.
- Ease-of-use features: CLI with GitHub Actions hooks, SBOM generation, and vuln prioritization—integrate via one-line docker commands.
9. Velero - Backup and DR for Cluster Resilience
- Why we need it: Data loss from failures or migrations is catastrophic; Velero safeguards against it with portable backups.
- Performance boost: Incremental snapshots minimize downtime during restores, preserving RTO/RPO for high-availability setups.
- Ease-of-use features: S3-compatible storage, cron-scheduled backups, and Kubernetes-native CRDs—restore with
velero restore createsimplicity.
10. Kyverno - Policy Engine for Security Enforcement
- Why we need it: Custom policies prevent misconfigs; Kyverno applies them natively without OPA’s learning curve.
- Performance boost: Validates/mutates resources at admission, blocking inefficient deploys (e.g., privileged pods) to maintain steady-state performance.
- Ease-of-use features: YAML policies with variables, test/validate modes, and webhook integration—write rules like Kubernetes manifests.
11. Telepresence - Local Dev Connected to Remote Clusters
- Why we need it: Remote debugging slows iteration; Telepresence bridges local code to prod-like environments.
- Performance boost: Intercepts traffic to avoid full cluster deploys, cutting debug cycles from hours to minutes and reducing test infra load.
- Ease-of-use features: Bidirectional proxying, volume mounts for state, and IDE plugins—run
telepresence connectand code as if local.
12. Devtron - All-in-One Platform for Simplified Management
- Why we need it: Fragmented tools create overhead; Devtron unifies deployments, observability, and gates.
- Performance boost: Built-in chaos testing and resource quotas optimize for reliability, preventing cascading failures.
- Ease-of-use features: Unified dashboard, GitOps workflows, and audit logs—deploy via UI wizards, no YAML mastery required.
13. Cert-Manager - Automated TLS Certificate Lifecycle
- Why we need it: Manual cert renewals cause outages; Cert-Manager handles issuance from Let’s Encrypt/ACME.
- Performance boost: Seamless rotations avoid service interruptions, ensuring encrypted traffic without perf hits from expired certs.
- Ease-of-use features: CRD-based issuers, webhook validation, and monitoring integration—declare certs in YAML, automate the rest.
14. Istio - Service Mesh for Observability and Security
- Why we need it: Microservices chaos needs mTLS and routing; Istio adds it without app changes.
- Performance boost: Intelligent load balancing and circuit breaking reduce tail latencies by 40%, enhancing resilience.
- Ease-of-use features: Envoy-based sidecars, Kiali visualizations, and traffic mirroring—define policies declaratively for zero-downtime canaries.
15. Jaeger - Distributed Tracing for Bottleneck Hunting
- Why we need it: Opaque failures in distributed systems; Jaeger maps request flows for root-cause analysis.
- Performance boost: Identifies slow spans, guiding optimizations that slash end-to-end latency in polyglot services.
- Ease-of-use features: OpenTelemetry integration, searchable timelines, and sampling controls—query traces via UI in seconds.
16. Fluentd - Unified Logging for Centralized Aggregation
- Why we need it: Scattered logs hinder debugging; Fluentd funnels them reliably to ELK/Splunk.
- Performance boost: Buffering and filtering offload log processing from pods, freeing CPU for app logic.
- Ease-of-use features: Plugin ecosystem (100+ outputs), config in Ruby-like DSL, and Kubernetes DaemonSet deployment—tail logs cluster-wide.
17. Prometheus - Metrics Collection and Alerting Standard
- Why we need it: Reactive monitoring misses issues; Prometheus scrapes for proactive insights.
- Performance boost: Time-series queries enable predictive scaling, preventing overloads and maintaining 99.9% uptime.
- Ease-of-use features: PromQL for queries, federation for multi-cluster, and Grafana dashboards—set alerts with simple rules files.
18. Falco - Runtime Security for Anomaly Detection
- Why we need it: Post-deploy threats like shell spawns go unnoticed; Falco alerts on them in real-time.
- Performance boost: Kernel-level eBPF rules with minimal overhead (less than 1% CPU), securing without slowing workloads.
- Ease-of-use features: Sysdig-backed rulesets, webhook outputs to Slack, and custom falco.yaml—tune policies via YAML.
19. Goldilocks - Resource Rightsizing Recommendations
- Why we need it: Over/under-requests waste money or cause OOMs; Goldilocks baselines usage for fixes.
- Performance boost: VPA integrations suggest limits that pack nodes 20-30% denser, reducing scheduling delays.
- Ease-of-use features: Dashboard with histograms, namespace scoping, and exportable YAML—apply recs with one kubectl patch.
20. Tilt - Local Dev Loops for Instant Feedback
- Why we need it: Slow build/deploy cycles kill productivity; Tilt live-reloads for rapid prototyping.
- Performance boost: Syncs file changes to clusters without full rebuilds, accelerating CI feedback and reducing test flakiness.
- Ease-of-use features: Tiltfile scripting, UI for build status, and multi-service orchestration—
tilt upand iterate seamlessly.
21. Helm - Kubernetes Package Manager for Templated Deploys
- Why we need it: Repetitive YAML boilerplate slows teams; Helm packages apps as charts for reusable, versioned installs.
- Performance boost: Standardized releases enable blue-green deploys, minimizing disruption during upgrades.
- Ease-of-use features:
helm installCLI, values.yaml overrides, and chart repositories—search/install from Artifact Hub like npm.
22. FluxCD - Lightweight GitOps Operator for Continuous Sync
- Why we need it: ArgoCD is great, but Flux offers a simpler, pull-based alternative for smaller teams avoiding complexity.
- Performance boost: Reconciles changes efficiently with webhooks, reducing drift and enabling faster recovery from failures.
- Ease-of-use features: GitRepo/Kustomization CRDs, automated pruning, and SOPS encryption—
flux bootstrapgets you started in minutes.
23. Grafana - Visualization Layer for Metrics and Logs
- Why we need it: Raw Prometheus data is overwhelming; Grafana turns it into actionable dashboards for cross-team insights.
- Performance boost: Alerting on thresholds prevents resource exhaustion, optimizing for sustained high loads.
- Ease-of-use features: Plugin ecosystem (Loki for logs), templated panels, and sharing via snapshots—build dashboards with drag-and-drop.
24. Kustomize - Native Config Customization Without Templates
- Why we need it: Environment-specific tweaks fragment YAML; Kustomize overlays apply them declaratively.
- Performance boost: Generates optimized manifests on-the-fly, avoiding bloat and ensuring consistent resource allocation.
- Ease-of-use features: Built into kubectl (
kubectl apply -k), bases/overlays folders, and patches—version control configs like code.
25. Crossplane - IaC for Provisioning Cloud Resources via K8s
- Why we need it: Siloed infra tools complicate multi-cloud; Crossplane extends K8s APIs to AWS/GCP resources.
- Performance boost: Composable provisions align infra with app scaling, eliminating over-provisioned external services.
- Ease-of-use features: XRD/CRD definitions, provider packages, and RBAC—
kubectl applyyour entire stack uniformly.
Implementing even half of these tools can transform your Kubernetes workflow from reactive firefighting to proactive mastery. Start with observability (Prometheus + Grafana) and GitOps (ArgoCD or Flux), then layer in security and autoscaling. What’s your go-to tool? Share in the comments!
Cheers,
Sim